Tutorial on documenting your data using tables#
This is a step-by-step guide to help you document your resource with the SSbD ontology using table-based workflows (for example, Excel). Note that you are free to use which ever editor you like, as long as the resusling tables can be converted into csv-files and the columns are named according to the specifications below.
What is a resource and why document it?#
A resource is the thing you want to describe and share in a structured way.
In practice, a resource can be a dataset, a software tool, a workflow, a model, or another documented digital object. Note that a resource can be either a class (a concept) or an individual (a specific instance of a concept). That means that you can document a type of experiment or
simulation (a class) as well as a specific experiment or simulation (an individual).
Documenting your resource means capturing the key metadata about it in a clear and reusable format. This is important so that existing datasets, sodtware tools and other resources can be easily discovered, understood, and reused by others. It also allows you to connect your resource to other related resources, which can enable new insights and applications.
The goal of this guide is to help you capture the key metadata for that resource in a clear and reusable format.
Quick introduction to classes and individuals#
When documenting data, we need to describe both classes (concepts of things) and individuals (actual instances of things). For example, there is a difference between the concept of a pen and one specific pen. If I ask my child to bring me a pen, I do not care which pen she brings, but she understands the concept and brings an actual individual pen.
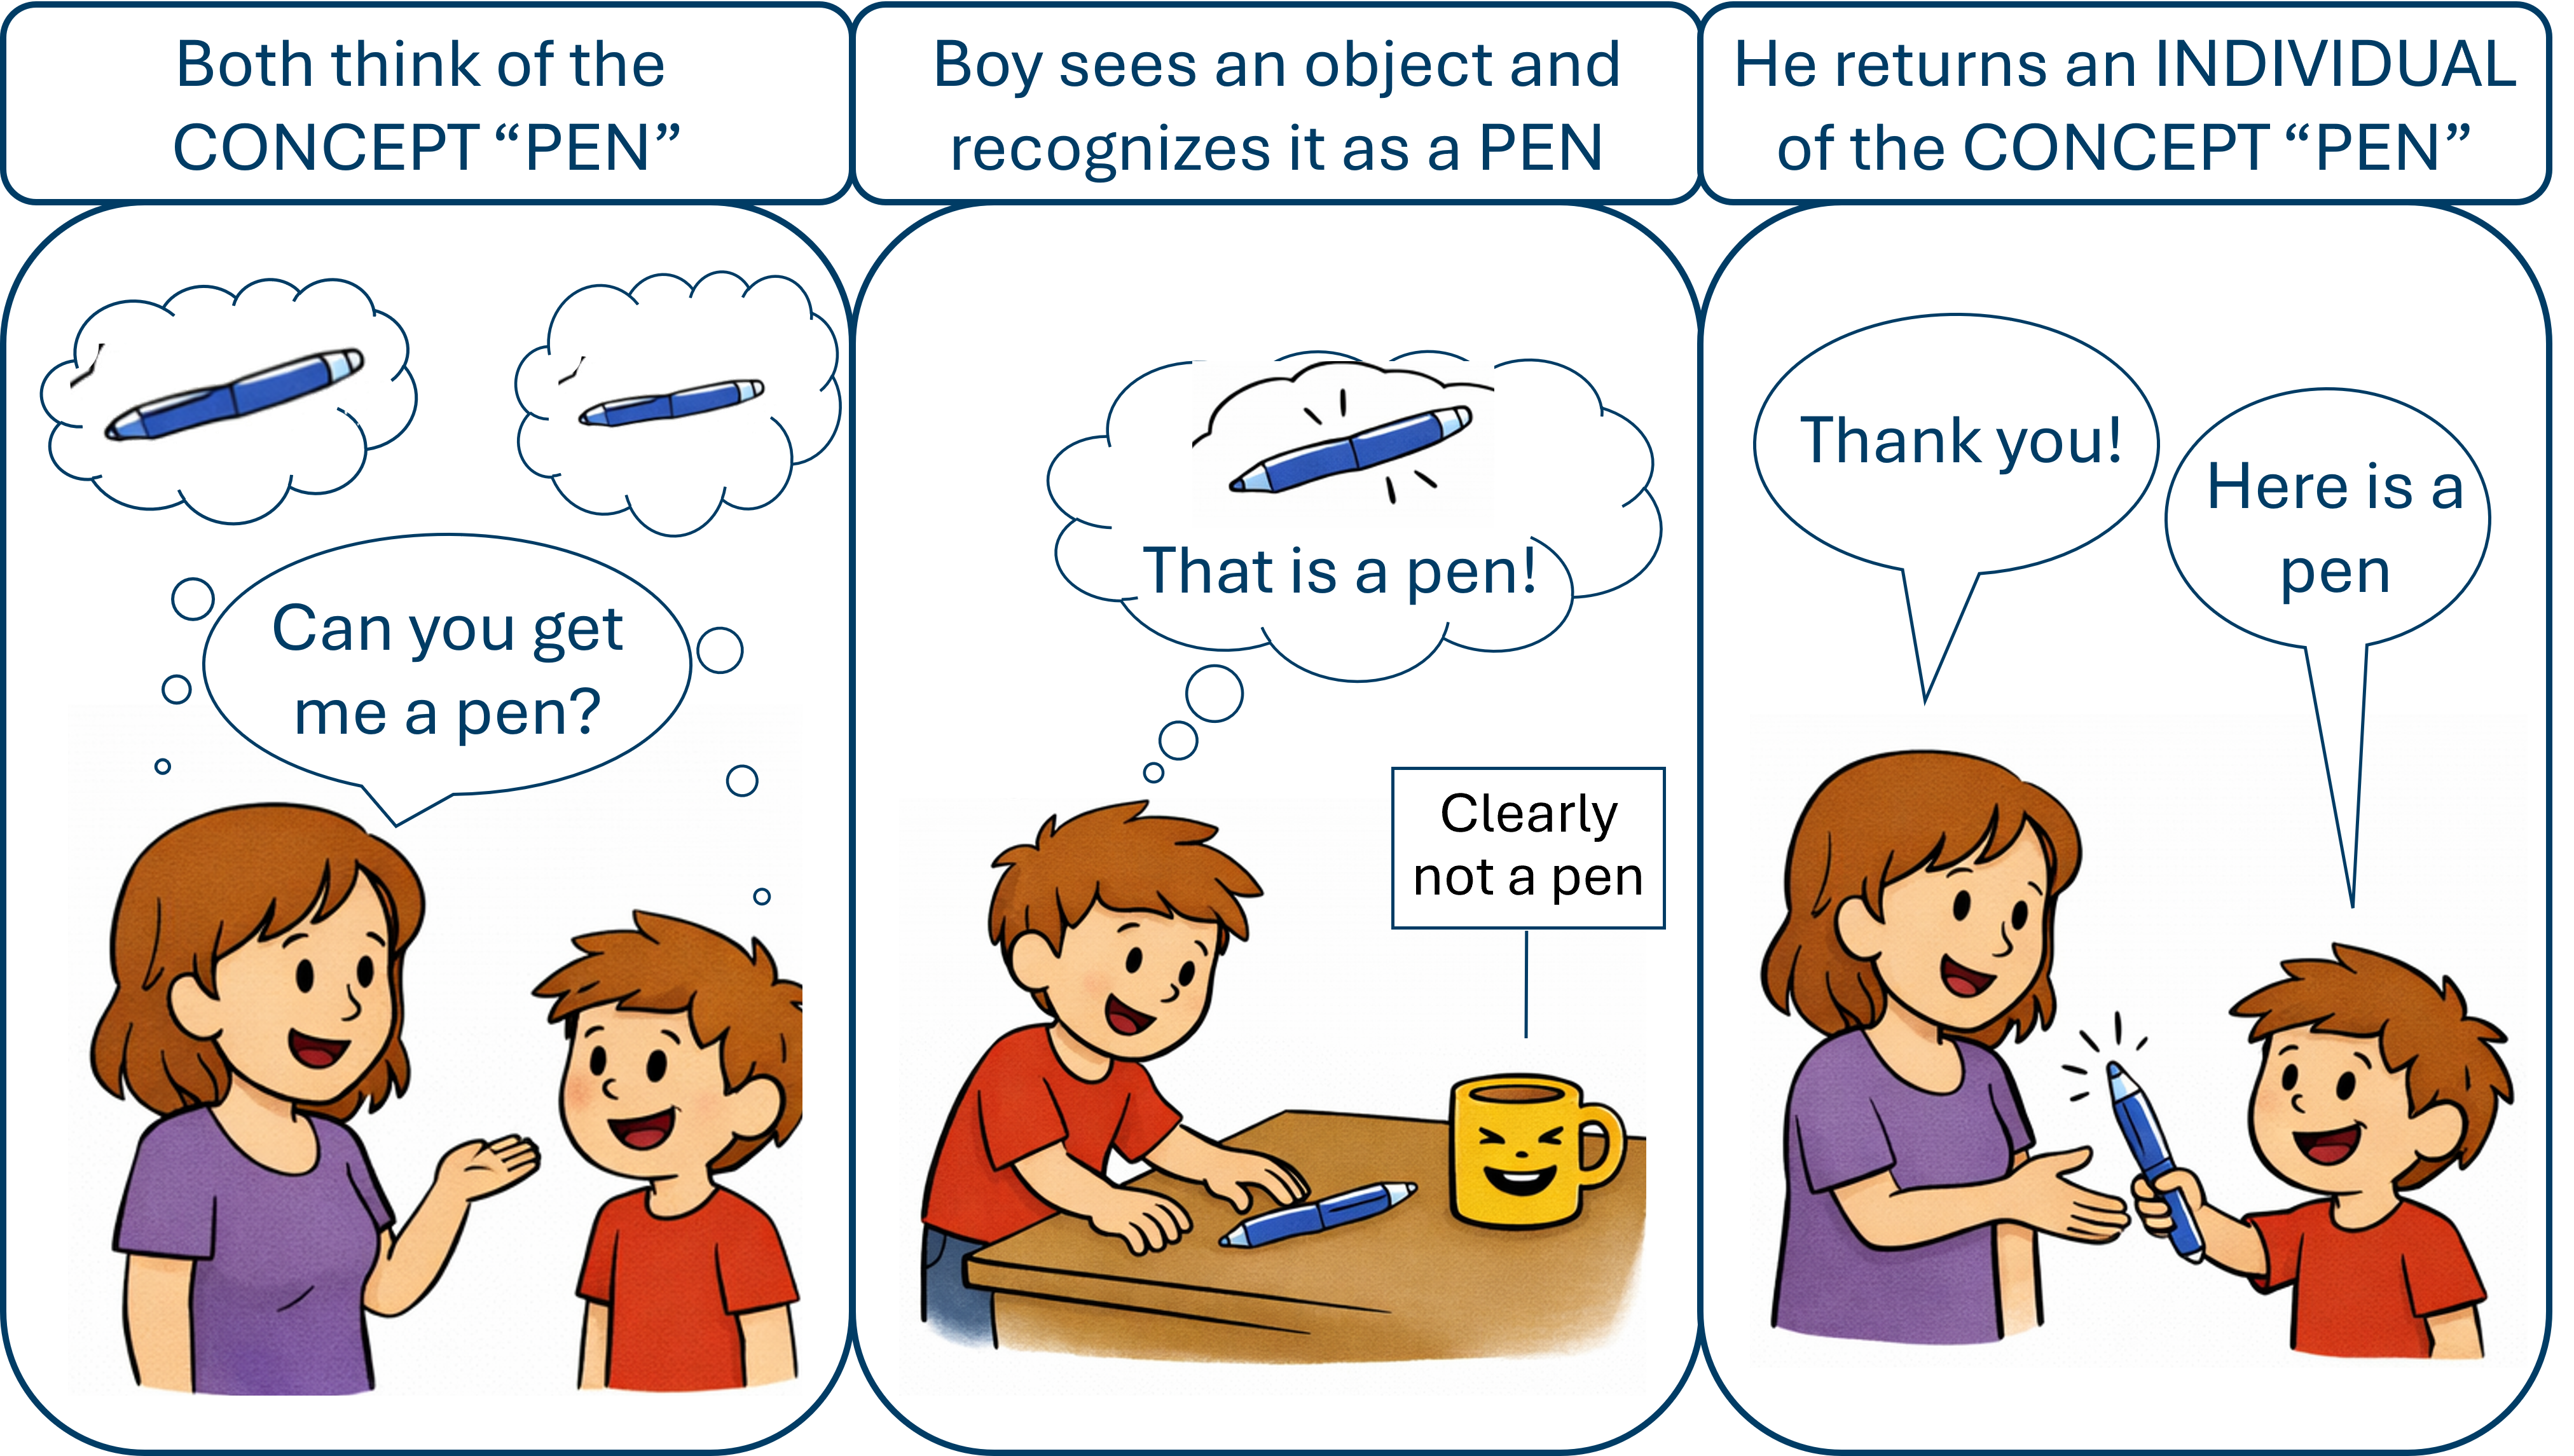
Figure 1. Cartoon illustrating a request for a pen (concept) and the return of an individual pen. Image created partly with ChatGPT (OpenAI), 2026.
Similarly, we can ask for a specific type of experiment or a type of dataset. However, this requires that the concepts of these types are well documented so that both machines and humans can help us find the right resources. In Figure 2 below, examples of resources, both classes (concepts) and individuals, related to running and experiment/instrument are shown.
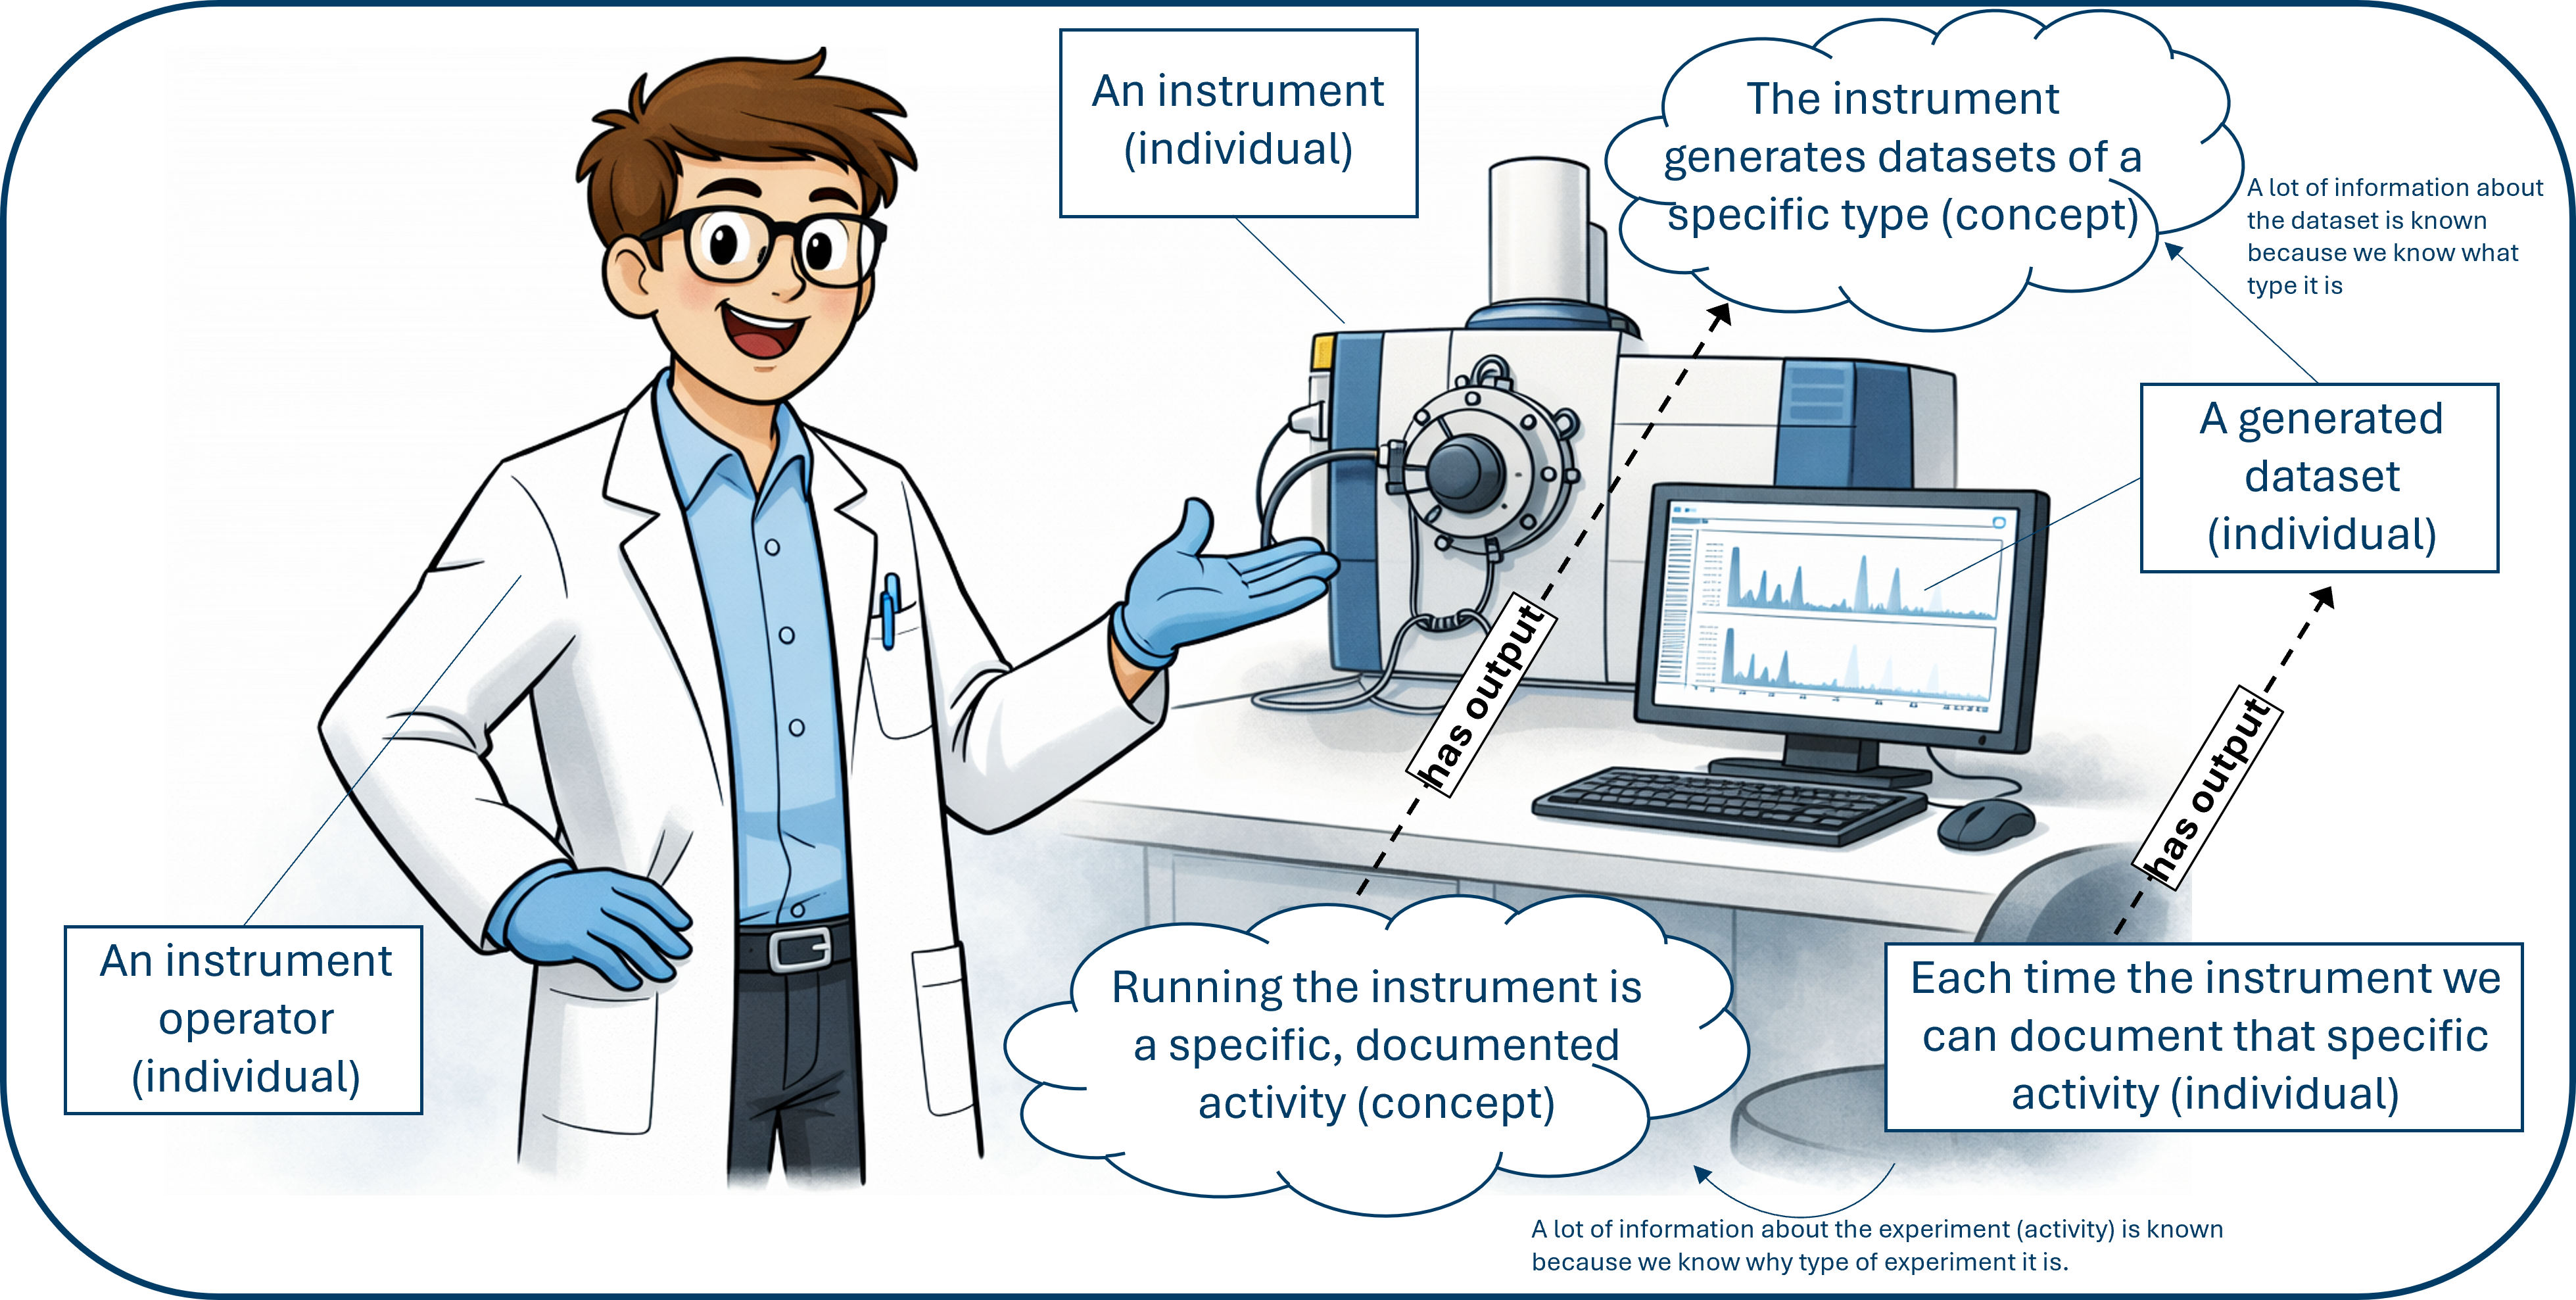
Figure 2. Cartoon illustrating some concepts and individuals related to of experiment. Image created partly with ChatGPT (OpenAI), 2026.
The various concepts and individuals are connected together with properties, which can be used to describe the relationships between them. For example, we can document that a specific dataset (an individual) is an instance of a specific dataset type (a class). This dataset is also generated by a specific experiment (another individual), which is an instance of a specific experiment type (a class). The relationship between the classes (concepts) is maintained at the individual level. This means that the operator can ask many different questions that connect the various resources together, such as “find me all datasets that were generated by experiments of type X”, or “I want a dataset of type Y, how should I proceed?”. Even better, we can connect various concepts together and for instance create workflows that connects datasets and simulations. This is more generally shown below.
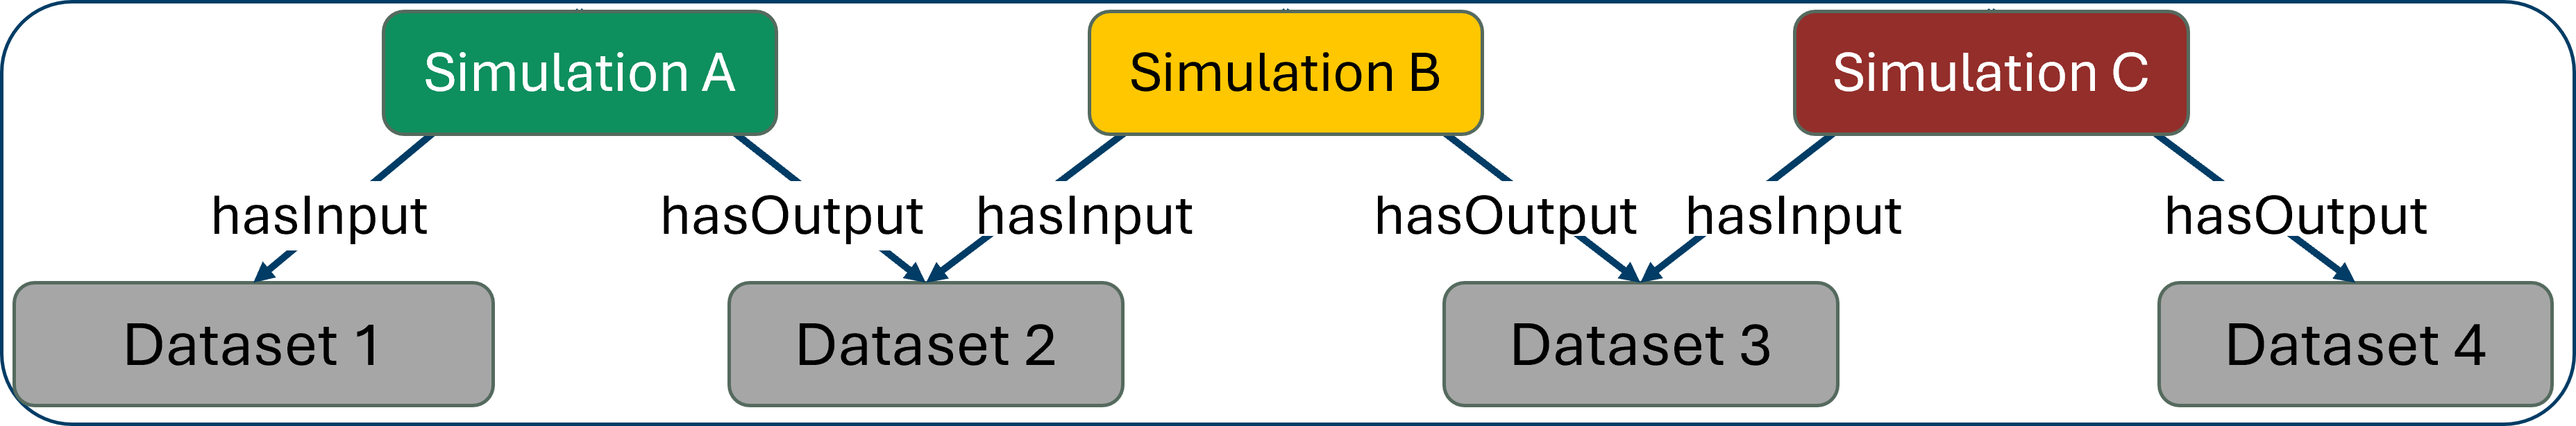
Figure 3. Concepts of datasets and simulations can be connected together in a workflow because
we have documented what the inputs and outputs of the various simulations are. Note that the relations between classes, i.e. the concepts, must be implemented as
restrictions and each hasInput and hasOutput should actually include a qualifier e.g. hasInput some.
Documenting your resources in practice#
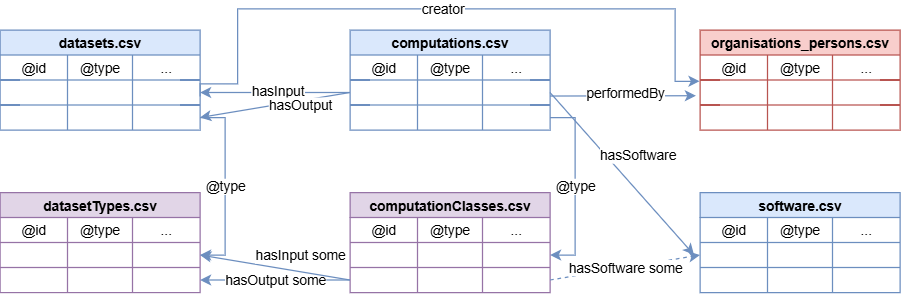
It is important to realise that we often want to document both existing datasets and concepts (such as activities) that generate datasets, as well as types of datasets that do not yet exist. We are here presenting examples of how to document dataset types (as concepts), computation software (as individuals), indicators (as concepts), and computations (as concepts) in tables, where each row documents a class or individual. The tables can then be used to generate a knowledge graph (expressed with RDF) that can be queried and integrated with other resources.
In Figure 4 below some examples of tables and how they are related are shown.
How to construct the tables#
Each row in the table documents a resource.
The column labels in the header row are mapped to properties in an ontology (and belong therefore to a controlled vocabulary).
There is a column @id, which is the unique identifier for the resource. For classes, this is an IRI (Internationalized Resource Identifier) that uniquely identifies the concept in an ontology. For individuals, this is an IRI that identifies the specific instance. (NB: in the Google spreadsheets this column is called identifier, but it is the same as @id. Please use @id in your own spreadsheets.).
There are one (or more) @type columns, that indicate whether the resource is a class or an individual, and also what kind of class an individual is a member of (for example, a dataset type, a software tool, etc.). For classes, only one @type column is allowed with value
owl:Class. Individuals can have more than one type.For classes, there is a column subClassOf, which indicates the parent class that this class is a subclass of. Several
subClassOfcolumns are permitted. For individuals, there is no subClassOf column because individuals are not subclasses of anything.For both classes and individuals, there are columns for the properties that we want to document (for example, label, description, hasInput, hasOutput, etc.). The properties that we want to document depend on the type of resource we are documenting and the use case we have in mind. The Object Properties, Annotation Properties and Data Properties in the SSbD Core Ontology are a good starting point for deciding which properties to document for each resource. They can be found in the Reference Documentation. (In the google spread sheets, the columns are filled with chosen properties.)
The values in the table should be filled according to the definitions of the properties in the SSbD Core Ontology.
All annotation properties should be filled with a literal value (for example, a string or a number).
All object properties should be filled with a IRI that identifies another resource (for example, a dataset type, a software tool, etc.). Here it is important to make sure that you refer to something within the correct range.
Table templates#
Below are some example templates that are used for documenting ssbd related resource within the pink project. Note that these are just examples and that you can create your own templates based on the properties that are relevant for your use case. The important thing is to make sure that the columns are named according to the specifications above and that the values are filled according to the definitions of the properties in the ssbd core ontology.
Expected minimum annotations by resource type#
The matrix below summarises which annotations where chosen as the minimum expected for each resource type in the PINK project (and this tutorial).
Property |
Type |
Software release (individual) |
Computation type (class) |
Dataset type (class) |
Agent (individual) |
|---|---|---|---|---|---|
@id |
annotation |
X |
X |
X |
X |
@type |
annotation |
X |
X |
X |
X |
accessRights |
object |
X |
|||
chemicalClass |
object |
X |
|||
creator |
object |
X |
|||
curator |
object |
X |
X |
||
datamodel |
object |
X |
X |
||
description |
annotation |
X |
X |
||
distribution.accessURL |
annotation |
X |
|||
distribution.downloadURL |
data type |
X |
|||
documentation |
object |
X |
|||
format |
annotation |
X |
X |
||
hasAPI |
data type |
X |
|||
hasGUI |
data type |
X |
|||
hasInput |
object |
X |
|||
hasOutput |
object |
X |
|||
hasSoftware |
object |
X |
|||
implementsModel |
object |
X |
|||
isSubmoduleOf |
object |
X |
|||
keyword |
annotation |
X |
X |
||
label |
annotation |
X |
|||
license |
object |
X |
|||
name |
annotation |
X |
|||
priorRelease |
object |
X |
|||
releaseDate |
data type |
X |
|||
rightsHolder |
object |
X |
|||
scopeNote |
annotation |
X |
|||
subClassOf |
object |
X |
X |
||
theme |
object |
X |
|||
inTierLevel |
object |
X |
|||
title |
annotation |
X |
X |
||
version |
annotation |
X |
[!NOTE] Another point: here prefixes (the term before the colon) are set to ‘pink’, because these tables are examples within the pink project. Typically, each provider, even within a project has their own prefix (which is short for their own namespace).
1. Dataset type table (class-level documentation)#
@id |
label |
description |
subClassOf |
theme |
@type |
|---|---|---|---|---|---|
pink:ToxicityDataset |
Toxicity dataset |
Dataset type for toxicity endpoints. |
pink:DatasetType |
pink:SafetyAndSustainability |
owl:Class |
pink:ExposureDataset |
Exposure dataset |
Dataset type for exposure-related data. |
pink:DatasetType |
pink:SafetyAndSustainability |
owl:Class |
2. Computation type table (class-level documentation)#
@id |
title |
hasInput |
hasOutput |
subClassOf |
@type |
|---|---|---|---|---|---|
pink:activity_qsar_prediction |
QSAR prediction |
pink:ToxicityDataset |
pink:ToxicityDataset |
pink:Computation |
owl:Class |
pink:activity_screening |
Activity Screening |
pink:ExposureDataset |
pink:ToxicityDataset |
pink:Computation |
owl:Class |
3. Software table (individual documentation)#
@id |
title |
description |
tierLevel |
implementsModel |
hasAPI |
accessRights |
|---|---|---|---|---|---|---|
pink:mytool-v1 |
MyTool v1 |
In-house software for endpoint prediction. |
pink:Tier3 |
pink:QSARModel |
https://example.org/api/mytool |
rights:PUBLIC |
pink:mytool-v2 |
MyTool v2 |
Updated release with improved descriptors. |
pink:Tier3 |
pink:QSARModel |
https://example.org/api/mytool/v2 |
rights:RESTRICTED |
4. Agent table (individual documentation)#
@id |
name |
@type |
|---|---|---|
https://orcid.org/0000-0000-0000-0001 |
Example Researcher |
prov:Agent |
https://example.org/org/acme-lab |
Acme Lab |
prov:Agent |
5. Dataset table (individual documentation)#
@id |
@type |
dcterms:title |
dcterms:description |
dcterms:publisher |
|---|---|---|---|---|
https://example.org/dataset/tox-001 |
pink:Dataset |
My toxicity dataset |
Measurements from in vitro assay campaign. |
https://orcid.org/0000-0000-0000-0001 |
https://example.org/dataset/exposure-001 |
pink:Dataset |
My exposure dataset |
Exposure observations collected in 2025. |
https://example.org/org/acme-lab |